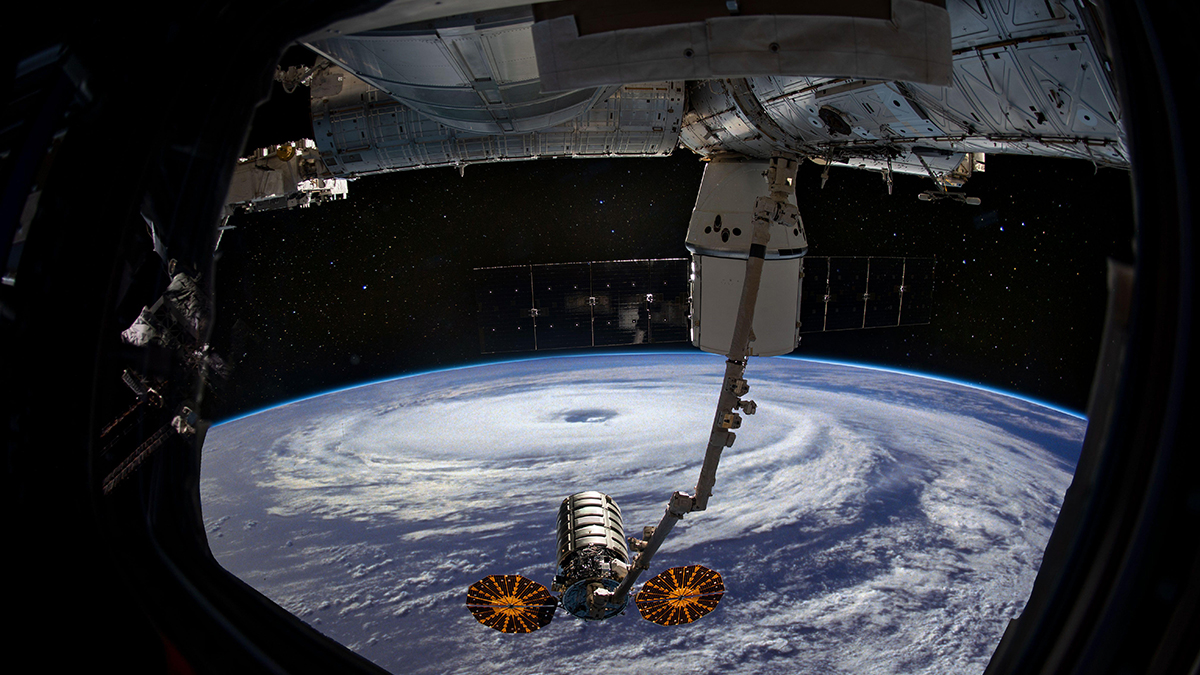
Insurers brace for active 2024 hurricane season
Sea surface temperatures in May are already at levels usual for August

Early forecasts suggest a busy year but more hurricanes does not necessarily mean higher losses, analysts say
Multiple early hurricane forecasts for 2024 have predicted higher-than-average activity this year.
In April the Colorado State University (CSU) forecasting team said it expects an “extremely active” Atlantic hurricane season this year, with 23 named storms, of which 11 will become hurricanes and five will reach major status.
Tropical Storm Risk (TSR) made a similar early forecast, in which it said to expect 70% more storm activity than the 1991 to 2020 30-year norm.
The forecasts should come as no surprise, as the conditions are right for high levels of hurricane activity.
Sea surface temperatures are perhaps the biggest component driving aggressive early seasonal hurricane forecasts, Josh Darr, global head of peril advisory at broker Guy Carpenter, says. By early May this year, they were running at the same levels normally seen in August, which is the start of peak hurricane season.
The day he spoke to Insurance Day marked the end of a 418-day streak of record Atlantic Sea surface temperatures.
The other big driver is the El Niño-Southern Oscillation (Enso) cycle. An El Niño period is when the tropical Pacific experiences warmer water temperatures than normal, while La Niña is a period of cooling.
La Niña conditions tend to create less wind shear, which allows thunderstorms to develop vertically more rapidly and spin with more strength. This helps convert warm sea surface temperatures into thunderstorms, which can then become tropical depressions and potentially hurricanes.
There is evidence La Niña increases insured losses. CSU recently published research suggesting during an El Niño period, the probability of a $10bn US hurricane loss is 10%; during La Niña that is closer to 60%.
The effect of La Niña is also tilted more towards Florida and the US East Coast, Darr says, whereas the Gulf Coast is largely unaffected by the Enso cycle.
“There’s well-known connections to Enso and La Niña in terms of the havoc it can wreak on the world insurance industry and nations around the world,” Andrew Siffert, senior meteorologist at broker BMS Re, says.
However, whether this translates to an increased number of landfalls – and whether these landfalls then turn into insured losses – is a more difficult question to answer.
More storms but not more losses
Last year was a perfect example of how increased activity does not necessarily translate to losses: 2023 was the fourth-most active season for storm count with 20 named storms and seven hurricanes, of which three were major. But there was only one landfall, by Hurricane Idalia, which landed in a largely unpopulated area.
“We just got extremely lucky about where the track was,” Elizabeth Harris, vice-president for modelling and research at Lloyd’s re/insurer Ariel Re, says. “You don’t have a significant industry loss until you have a major hurricane make landfall in one of about five metropolitan areas in the US.”
If the storm had made landfall just 100 miles further east, it would have hit the heavily populated Tampa area, Darr points out.
 Andrew Siffert, senior meteorologist, BMS Re
Early hurricane projections have little “skill” – meaning their ability to forecast accurately is little better than using a historic average. They do improve slightly by June and are usually quite good by August, Harris says, “but by then it’s not a forecast really. It is a forecast for September and October but by then we already have the portfolio locked in place.”
This is echoed by Siffert. “There’s basically no skill in forecasting April named hurricane activity,” he says, even given the advancements in data and technology over the past 10 years.
“I always wonder what we do with this information anyway. Ultimately a lot of [reinsurance] treaties get placed in June; they’re already in the market. And is one forecast going to change the rating environment? Not necessarily”
Andrew Siffert
BMS Re
“I always wonder what we do with this information anyway,” Siffert adds. “Ultimately a lot of [reinsurance] treaties get placed in June; they’re already in the market. And is one forecast going to change the rating environment? Not necessarily.”
Increasing frequency
Hurricanes have increased in frequency since the 1980s, but perhaps not for the reasons expected, Harris says. Climate change is likely to be one factor but there are other “much stronger signals” to explain the trend.
Part of the cause is a natural slowdown in ocean circulation in the tropics, leading to less heat in the north Atlantic. The other cause Harris points to is linked to a clean-up of sulphates from the atmosphere that has had a warming effect on sea surface temperatures.
High levels of sulphates in the 1970s and 1980s had a shading effect and removing those sulphates has allowed more shortwave radiation to reach the surface of the ocean. “Cleaning up air pollution has, unfortunately, led to more north Atlantic hurricanes,” she says.
There has also been a trend of increasing landfalls since 2017 compared with the previous 12 years. Between 2006 and 2016 there were no major Florida landfalls, “which is something we’ve really struggled to explain”, Harris says.
The devil is in the detail, Siffert adds. While 2023 was particularly active for an El Niño year, half of the storms seen were very short-lived and did not amount to anything.
“In the broad scheme of things, we really only had 12 robust named storms, which is right where you would expect in terms of average,” he says. “Our classifying of these named storms is very different from how it used to be, much more trigger-happy.”
Convective storm losses
Severe convective storms have different drivers from hurricanes and are perhaps more difficult to predict. “Severe convective storms are often highly localised and can happen with very little warning,” Rich Coyle, US commercial director at parametric insurer FloodFlash, says.
These losses have been on the rise for a while now, reaching record levels in 2023. Severe convective storms caused $71bn in insured losses last year, Gallagher Re reported, representing 57% of all insured catastrophe losses. Of this figure, $60bn of severe convective storm losses incurred in the US.
Last year was also the first time insured losses surpassed $100bn without a single event topping $10bn. However, the rise in losses is less to do with frequency and more to do with increasing exposure growth.
Overall, the frequency of severe thunderstorms has remained pretty constant, Darr says. What has changed from a meteorological viewpoint is the hail and tornado belt in the US has shifted further east, away from the sparsely populated plains of Nebraska, Oklahoma and Kansas to more heavily populated cities, including St Louis, Nashville and the Texas Triangle.
There has also been a change in seasonality, Darr says, with a disproportionate amount of activity now being seen in the off-season winter months and more bursts of activity during prime season.
But this is only a minor part of loss propensity, he continues. The bigger problem is population sprawl over the past 30 years, particularly the growth of connecting cities across the US’s interstate system.
“You can’t go anywhere in the US anymore without going off an exit and seeing a small subdivision, enclave or major factory placed there,” Darr says.
Over the past 10 years overall population migration in the US has been towards the south – caused by a range of social factors, starting with the 2008 financial crisis and accelerating with the pandemic. As a result, high-risk places like Nashville have experienced a population boom.
Not only does that contribute to population swell, but it also introduces a population that is not attuned to the disaster risk of an area, potentially exacerbating the impact of a storm or hurricane when it happens.
Add to this the high inflationary environment, which has greatly increased the cost of materials and labour, and it is a perfect storm for rising losses. “We’ve seen 40% to 50% increases [in reconstruction costs] in the past five years. That pretty easily turns an $800m loss into $1.4bn,” Darr says.
This is echoed by other analysts speaking to Insurance Day. “Really, there’s no clear signal in [loss data] with large-scale climate oscillations or climate change for convective storm,” Harris says. “Are they correlated? I don’t think we have any evidence in our short loss record that that is the case.”
These non-peak perils have been around for a long time, according to Siffert, who prefers the term “non-tail risk” to the increasingly outmoded term “secondary peril”. “There are many different things that are now bringing some of these non-tail risks to the forefront,” he says.
The human element
A lot of this is man-made. Most US wildfires are triggered by human causes, often electrical-based fires from downed power lines or ageing infrastructure. Similarly, damage from Winter Storm Uri in 2021 was largely a man-made loss event caused by a utility company that “maybe wasn’t as prepared as it should have been”.
“That would have been a pretty manageable event if the electricity had stayed on,” Siffert says.
He also cites population growth as a big driver of increasing losses, with more and more people moving to the “wildland-urban interface” – high-risk areas for forest fires. “It’s not always about climate change and it’s very easy to point the finger,” he adds.
 Elizabeth Harris, vice-president for modelling and research, Ariel Re
But being part of the problem also means humans can be part of the solution. “We’ve got to encourage homeowners to mitigate the [wildfire] risk by building defensible space, making sure they have the right type of roofing materials, doing little things that will increase the chances of limiting fire damage to structures,” Siffert says.
This is being done both through education and through policy changes, such as increasing deductibles. Better risk models allow better risk assessments that provide much more detail than 10 years ago and these insights are being passed on to property and business owners.
“Really, there’s no clear signal in [loss data] with large-scale climate oscillations or climate change for convective storm. Are they correlated? I don’t think we have any evidence in our short loss record that that is the case”
Elizabeth Harris
Ariel Re
Building codes are also improving. After Hurricane Charley in 2004, which hit Cape Coral and south-west Florida, residents built back to better codes. These made a tangible difference to losses when Hurricane Ian hit in 2022, where roof damage was less severe. “We’re seeing the insurance industry is becoming more collaborative with policymakers and helping provide an avenue for insurance to help push for mitigation efforts and build longer-term stability,” Siffert says.
He concludes: “If insurance becomes unavailable in an area, you’ve got to change something. You’ve got to change your way of thinking, change how that building is going to be rated by building in more risk measures.”